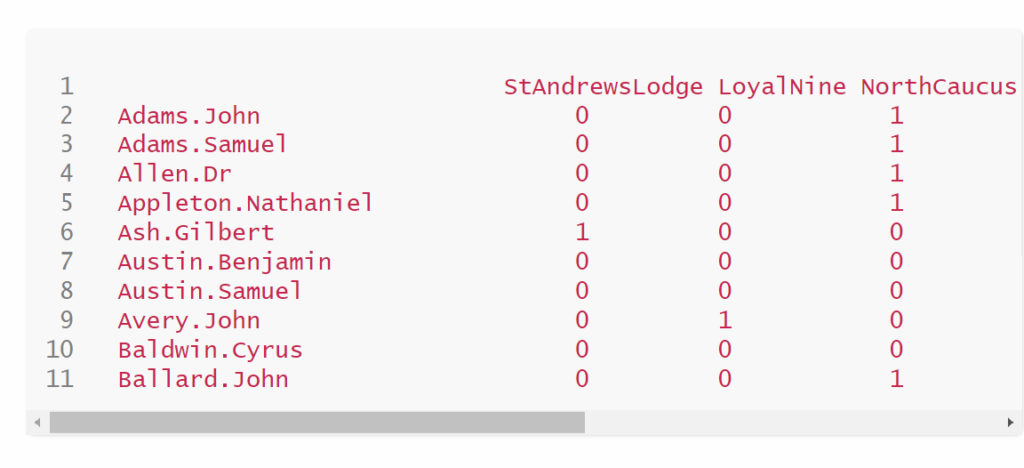
When exploring the various DH network projects, I found some of them relatively difficult to understand. The only one that was visually intriguing and provided context for the information was “Using Metadata to find Paul Revere.” The metadata used was about who were members of specific organizations within the colonies. The project itself was easy to understand, and the author did a good job explaining the process. The original metadata was gathered and formed into a regular table. The table had rows of individuals involved in different ‘”terrorist” groups within the colonies. The columns in the table represent the different groups. If a member was part of a specific group, there would be a “1” to indicate their participation in the group.
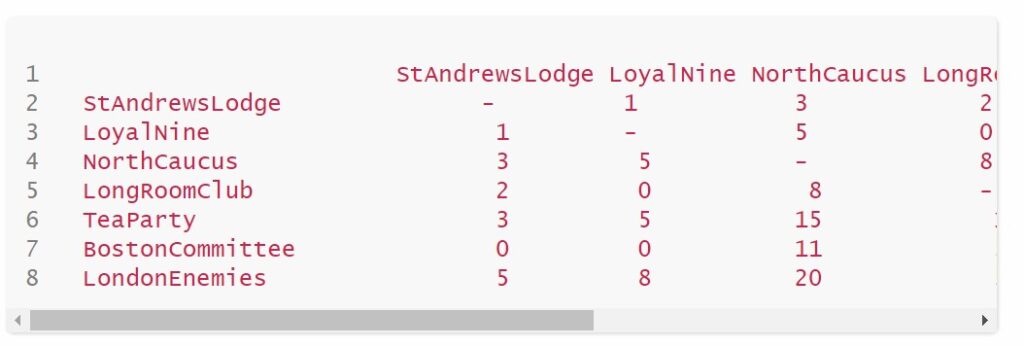
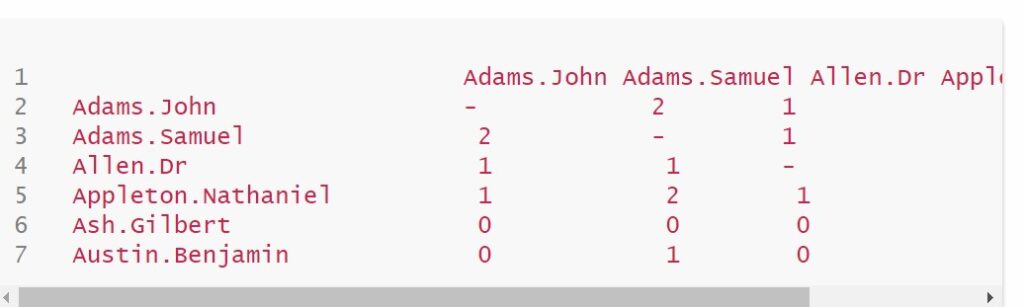
Mr. Ron Breiger, a colleague of the author, was the one who noticed the metadata they had was in the form of an adjacency matrix. Using a multiplication matrix, they found information they wouldn’t have been able to see with just the table. So, they decided to take the adjacency matrix of people and groups and flip it over on its side. This is so that the rows were now columns and vice versa. Two additional tables were formed using a multiplication matrix. The first is person by person table, and the second is a group by group table. They then turned this data into a network visualization.
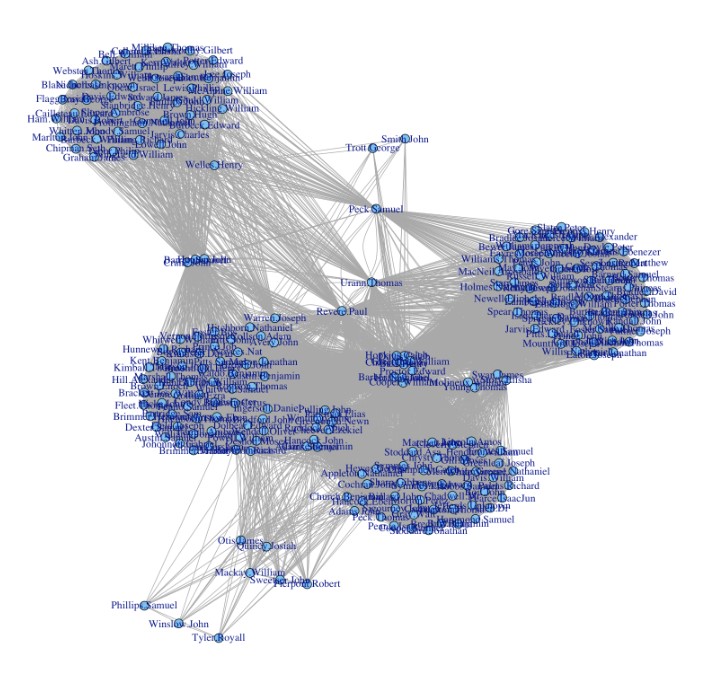
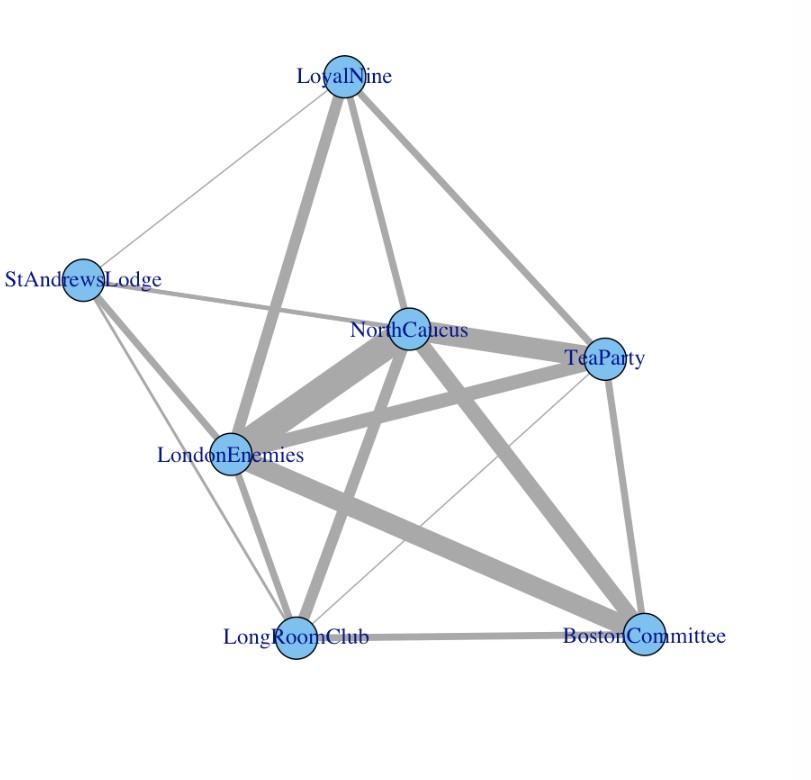
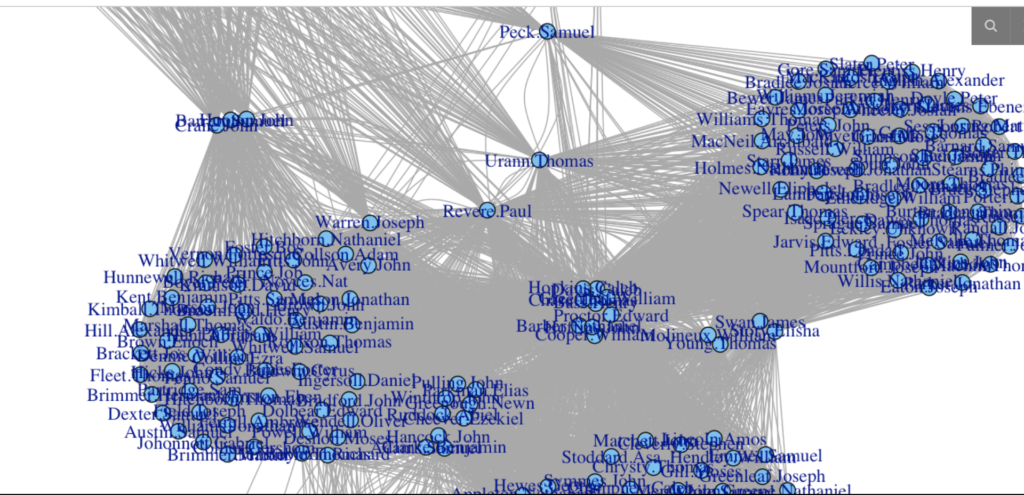
In the people-by-people network visualization, the nodes are people in the groups within the colonies. The edges are the groups that these individuals are involved in. In the group-by-group network visualization, the nodes are the different groups within the colonies. The edges number of common members of the two groups (nodes). When zooming into the people by people network visualization, you can see Paul Revere had many connections to different individuals because they are in the same group.
In the article, the author also went into greater detail in calculating more matrices and information about the “specific terrorists” by finding the shortest path between two people. That information was a little more confusing. Overall, I found the process very interesting and sophisticated. I didn’t expect manipulating metadata in various ways provided more information than what is seen.

I like the visualization because, though it is gross to look at, it gives you a strong message that all of these groups were tightly intertwined. You can’t really see specific informations like names but you don’t really need to know this information. What’s more important is you generally how many groups there were, how big they were, and which groups were especially close to each other.