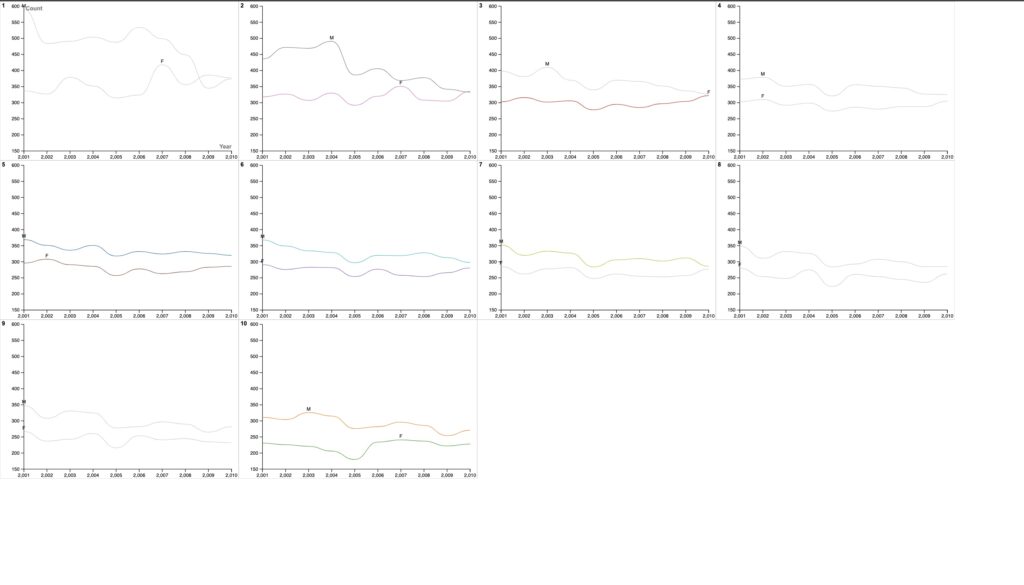
In order to illustrate the gender distribution of the top 10 baby names over a ten-year period (2001–2010), I chose to use Rawgraphs.io. In order to do this, I used a line graph, concentrating on the popularity of baby names according to gender. The simplicity of line graphs, which enabled a natural display of patterns across time, was the motivation for this decision. The lines’ fluidity offered an elegant means to illustrate how each name’s popularity fluctuated over time, allowing viewers to easily identify peaks and decreases.
Initial attempts at showing all the data points on one single line graph faced difficulties with reading and visual clutter. In response, I carefully created the graph, using color differences to separate both genders and to make sure each line was clearly visible. This approach improved the visualization’s clarity and made it easier for viewers to recognize specific name trends.
My method of data visualization was inspired by Lin’s resourceful lecture. Her advice encouraged me to focus on the most important information while removing unnecessary information to produce a clear portrayal. Lin’s attention on repairing incorrectly structured graphs served as the inspiration for my changes, which improved readability. Additionally, she introduced me to the Quantitative Resource Center, which widened my resource network. Lin’s insights had an impact on my work, highlighting the significance of effective design in communicating important findings.
My visualization project has deep importance in the context of Digital Humanities. Names are really humanistic since they are founded in human culture and identity. They capture the core of human experiences and reflect societal customs, cultural changes, and individual preferences. My graphs, which reflect the complex diversity of human experience, capture the shifting trends in New Zealand’s infant naming customs and offer a view of social preferences and thoughts. My visualization project effectively captures the spirit of Digital Humanities by fusing technology, data, and humanity while providing an in-depth examination of the human condition through the perspective of changing naming trends.

I thought you did a very good job of creating a concise line that accurately displayed the popularity of baby names in relation to gender. I also had similar difficulties as you did when it came to dealing with ease of reading and visual clutter. Overall I thought you made a thoughtful and straightforward graph.
I wonder if a legend would be helpful to better demonstrate what your graphs are depicting. I’m assuming you’ve split the graphs into ten different graphs organized by rank and including one male and one female name (those two that share the same rank). It’s interesting that the most popular male name is significantly more popular than the most popular female name until 2009 when they switch places. I wonder if that whole naming your son after you thing made this name really popular but within these years became less common of a choice. Fascinating!