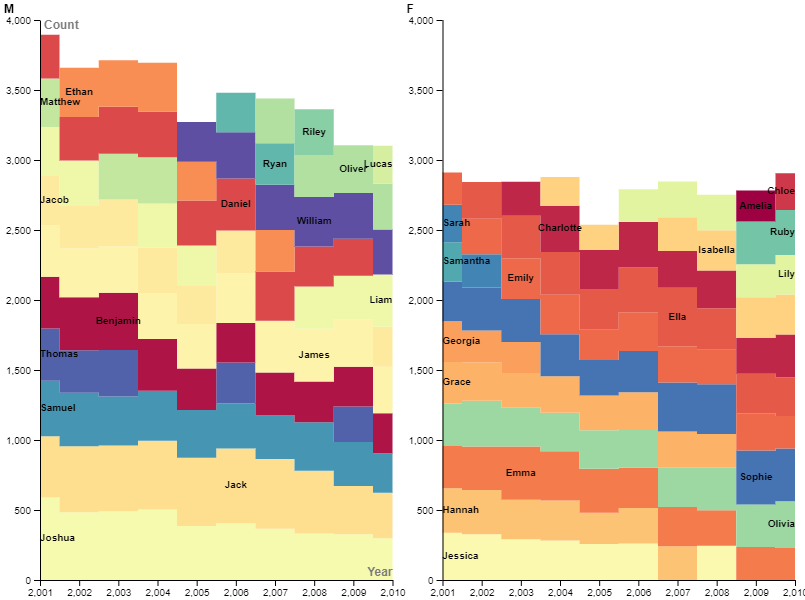
I chose to visualize how the 10 most popular male and female baby names in New Zealand and their counts varied from 2001 to 2010. To do this, I chose to use a streamgraph, which shows how counts of things vary over time. Usually the streams are fluid and connected, but I thought this was misleading, as it sometimes implied that some names were in the top 10 for a year when they actually were not. Instead, I chose a block style, which makes the count of each name more clear for each year. I also chose a color scheme that made it more obvious which box corresponds to which name, although it is still unclear in some places. I also like how these graphs show the total amount of babies named a top 10 name for each year.
I have always thought the way data is visualized and presented is important, so I found Lin’s lecture interesting. I believe that literature and the humanities can be used as data without losing the core message of the sources, as Scott Selisker and Holger Syme argue in their “In Defense of Data” article. I guess my visualization is related to anthropology and social sciences, which are in turn related to the humanities. My visualization could be used to observe trends in baby names in New Zealand, providing insight into factors that influence people’s choices for their child’s name.

I think it was useful to split the data into two graphs to incorporate the gender information; I chose to omit the gender factor completely, but because you kept that information your data visualizations allow for that to be compared along with the name popularity information. It’s interesting to see that what people choose to incorporate from the data set differs and how that creates variety in the graphs made from one data set.
This is a really cool looking graph. I think it was a good decision to split the graphs by gender because a steamgraph is already quite complicated to read I don’t think doubling the names would have made it any easier. I think the steamgraph does a good job of showing the general trend for these names. While you can’t really tell exactly how much count each name has at a time but for what its saying you don’t really need to know that. You can still tell what is bigger which shows the trend. Great job!