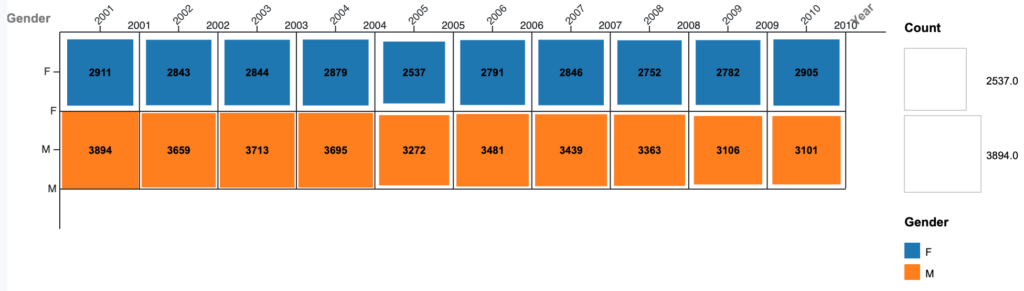
This graph compares the proportion of male and female babies in New Zealand who had one of the 10 most common names. You can see from this graph that many more male babies had one of the 10 most common names than females in 2001. This number drops over the next 10 years while the number of female babies stays about the same. A matrix plot does a good job of showing this information because it uses visual aids like size of boxes and eliminates unnecessary information like the individual names. I added grid to make it easier to compare box sizes and a key to make the graph easier to read quickly.
This graph shows information that might not be clear just from looking at a spreadsheet of numbers. As Lin talked about, it highlights certain information within the data instead of just showing all of the data at once. Specifically, it uses color draw you to compare gender and concentration of names.

This choice of what to graph is super interesting! The comparison between male and female baby name popularity is particularly interesting, I guess maybe male babies are slightly more likely to be named popular names than female babies? I agree that using the size of boxes definitely helps understand this information comparatively.
I really liked how you decided to present your data. I think your visualization tool is really efficient for this type of comparison! I am surprised to see the gap between male and female baby name popularity from 2001 to 2010. I did not think it would be a dramatic change. This makes me wonder which names started to become less popular and what caused the want for variety in names.