Robots Reading Vogue is a Digital Humanities project created by Lindsay King and Peter Leonard that explores several different ways to digitally analyze and present data from Vogue magazines published from 1892 to 2023. The project’s website contains many different presentations and interpretations of all sorts of information from Vogue magazines over time, from the colors present in their covers to the frequency of different brands’ advertisements in the magazine. For this blog post, I chose to focus on the Colormetric Space experiment, which aims primarily to analyze the use of color in Vogue covers through the decades.
Sources
Like with all of the projects within the Robots Reading Vogue project, the Colormetric Space experiment uses the digitized Vogue magazines that are publically available through the Vogue Archive, launched in 2011 by Vogue to support studies in fashion design, fashion history, gender studies, photography, and more. This experiment in particular uses hundreds of Vogue covers from the 1890s to the 2010s, approximately one per month of each year. Unlike earlier projects, like the experiment analyzing Vogue covers by overlaying 10 covers from each decade (one per year), that required much more manual labor, most of the processes of this experiment were more automated. This allowed the creators of the project to analysis a much larger volume of covers.
Processes
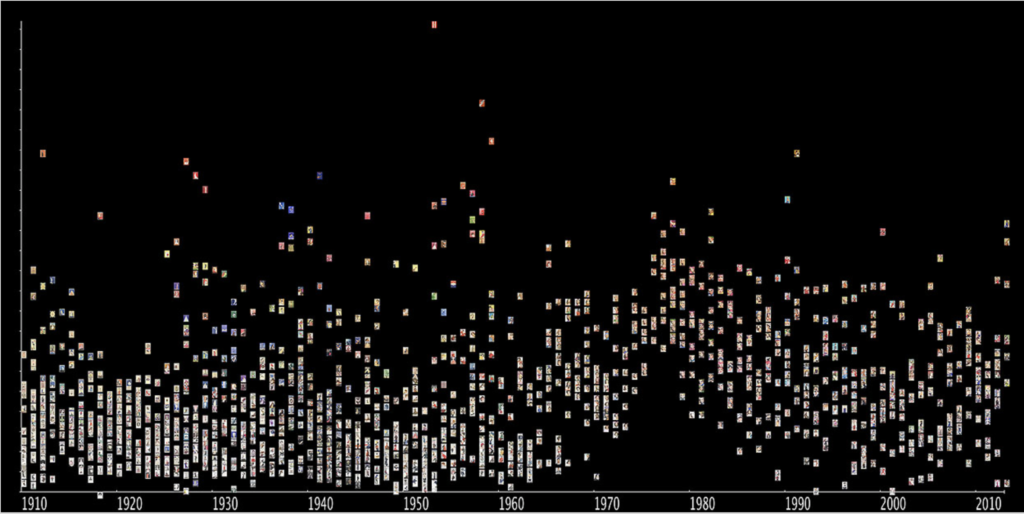
To analyze over-a-century’s worth of Vogue magazines, the project creator’s used ImagePlot, a free tool created by Lev Manovich and his team that analyzes image collections by their hue, saturation, and brightness, and outputs usable, numerical data that users can further organize and utilize in data visualization projects. Using this tool, the project creators were able to graph covers by how “colorful” they were in order to analyze patterns over the decades.
Presentation
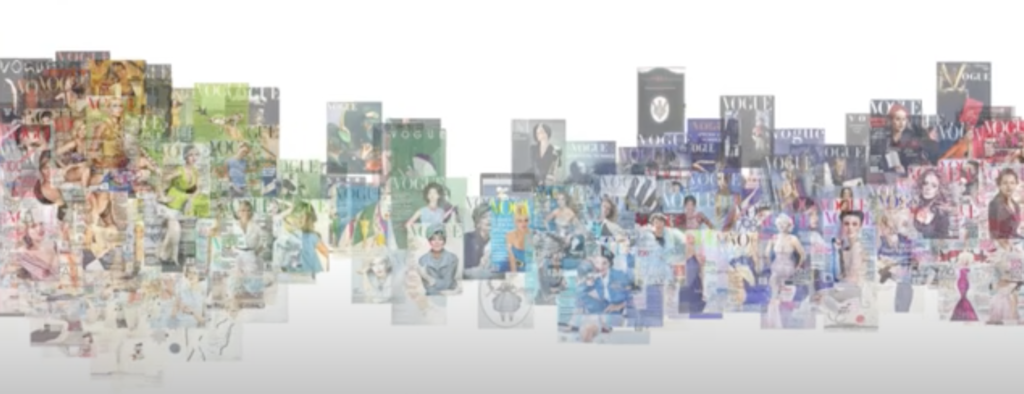
Because ImagePlot outputs the images in a high-quality format, creating multiple graphics would be uch harder. To solve this problem, the creators decided to use a different tool that would be able to handle more data. By using the data with the web visualization framework d3.js and creating a dynamic plotting program that lets the user choose which axes to plot the data on, they were able to create more creative visuals that graphed the data.
Conclusion
One question that arose from breaking this project down is how exactly the saturation of the image is calculated in ImagePlot and how the program is able to “read” this data.

The Colormetric space is interesting. It is odd in the second image how there is a very evident trend of colors in vogue. I wonder what that says about fashion? In regards to your question, I wonder if it takes an average of all the pixels in the cover to find the color of the cover and sorts by that? I also wonder what use this could have if any other then just being interesting, in the source paragraph you said vogue made it to support fashion history so I guess the usage could be in that.
Hi! The second image is only a graph of saturation vs. hue, so not a graph of trends over time. I would say this research could have a lot of uses, particularly if we’re talking about all the research in the Robots Reading Vogue project, not just the Colormetric Space project. For this project specifically, though, I imagine one of the primary uses would be in research regarding marketing/advertising trends over time, since the colors chosen to make the cover the most marketable and eye-catching would probably shift with the taste of their target audience.