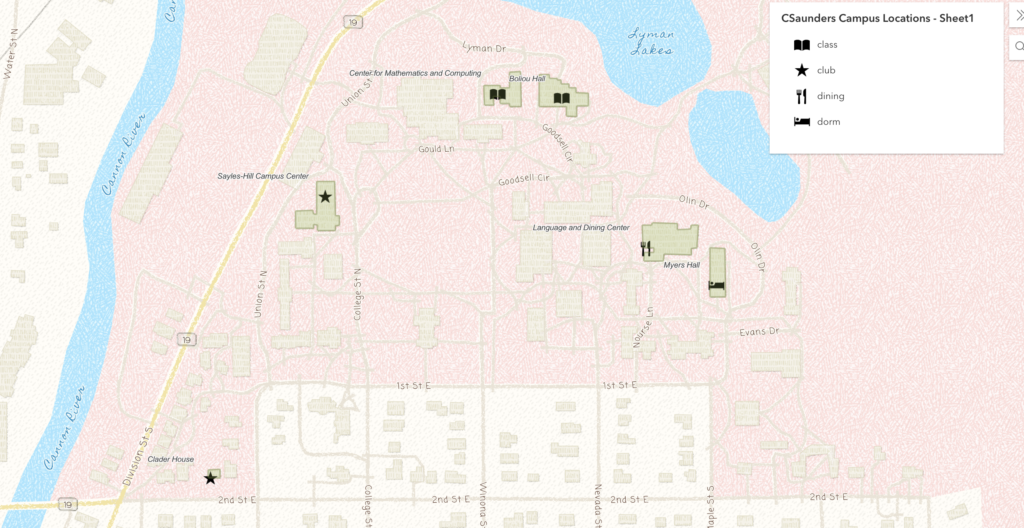
(My spreadsheet, and the web app for my map.)
I really liked the process of mapping in ArcGIS! It was interesting to visualize the different places I frequent on campus. For my locations, I chose the CMC and Boliou because I have classes there, Myers because I live there, LDC because I typically get breakfast there, and Sayles and Clader House because that is where two clubs I am active in typically meet (Babyteeth and Carleton’s A Drag). To show the information about the locations, I chose to focus on the type of location by choosing symbols I thought correlated to each function. Unfortunately, I had to make the labels diagonal from the symbols, instead of more clearly next to, because otherwise the labels for the CMC and Boliou would cut each other off.
I think ArcGIS and web mapping are really useful tools for DH projects that have lots of interesting possibilities for applications. More generally, web mapping is a helpful tool for DH work because it allows data about locations and spaces to be easily shown. The interactive element of a digital map is particular helpful, since it allows the user to zoom in or out of specific locations without losing all of the information. ArcGIS is a particularly useful web mapping tool, since it is pretty intuitive to use. Being able to make a digital map without too much experience is really useful; for one, it allows a lot more people to make maps that are personalized to their experience, like this lab assignment.

The visuals on your map are really nice! The symbols also accurately clarify what each building means to you besides the title. I think the text problem you briefly had is a symptom of mapping, for both digital and paper. I wonder if splitting the “Center for Math and Computing” could have been split into two lines to make it less inconvenient.
I love the visuals on your map! The key and the symbols make it very easy to understand and the colors are very pleasing to the eye. I also like that you changed the default theme of the background map to fit with the color scheme. I agree that ArcGIS makes it easy to personalize your map to your specific goals and that its interactivity is a bonus to analyzing spatial patterns.