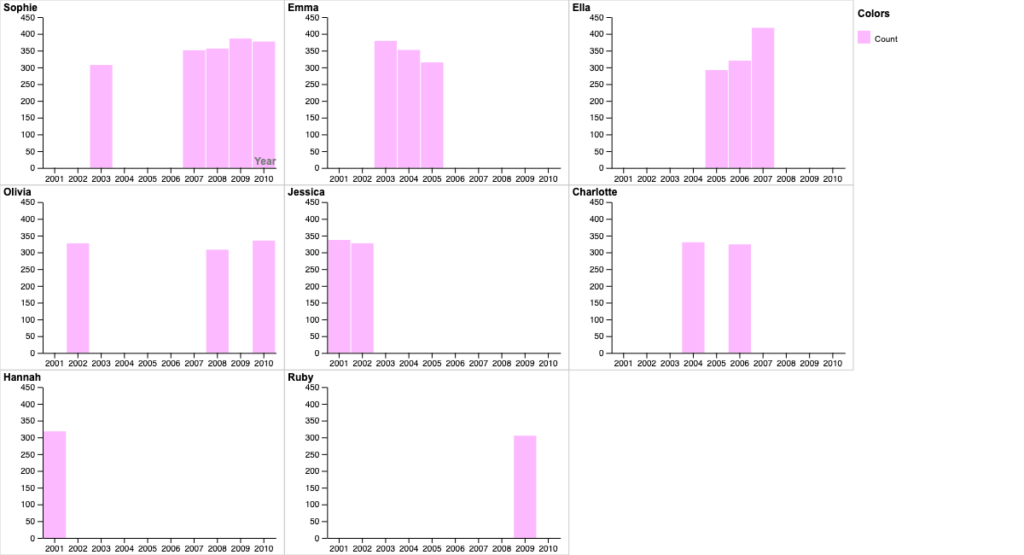
I chose to focus exclusively on the first and second most popular girl names in New Zealand from 2001-2010, excluding any data of boy names. I chose to focus on girl names because I wanted to clean up the data in order to focus on a specific trend. When I used the first data set and inputed it into RAWGraphs I felt the data was too scattered and I couldn’t find a graph that felt like it had a purpose. It took a lot of trial and error to realize it was best to slim the data down and make the graph more visually appealing. When I had the data from both the boy and girl names I felt like I’d be the only one who understood my graph.
I created several bar charts to represent the popularity of baby girl name’s throughout the years. The X-axis depicted the year, the size of the bars represented the name’s popularity, and the color pink was chosen to signify the data. Pink, often associated with baby girls, seemed fitting for this context. Each bar chart sorts each girl name and it starts from most popular girl name throughout the years Sophie (top left corner) to least popular girl name throughout the years Ruby (bottom right corner).
During Lin’s lecture, i was able to learn the significance of aesthetics and clarity when creating meaningful graphs. Lin’s words resonated with me when she mentioned that even with a wealth of data if the graph doesn’t represent the data in a visually appealing and easy to understand way than it is useless. A meaningful exercise she conducted was showing us a graph that was not representative of its data and asking us to brainstorm ways to improve the graph’s clarity and visual appeal. I feel this exercise made learning the different types of graphs a lot easier, as well as, teaching how important it is to think about color and crowdedness in graphs.
