I explored the University of Richmond’s “Mining the Dispatch” project, linked here: https://dsl.richmond.edu/dispatch/. It analyzes subject trends of Richmond’s Daily Dispatch, the town newspaper, from 1860 to 1865.
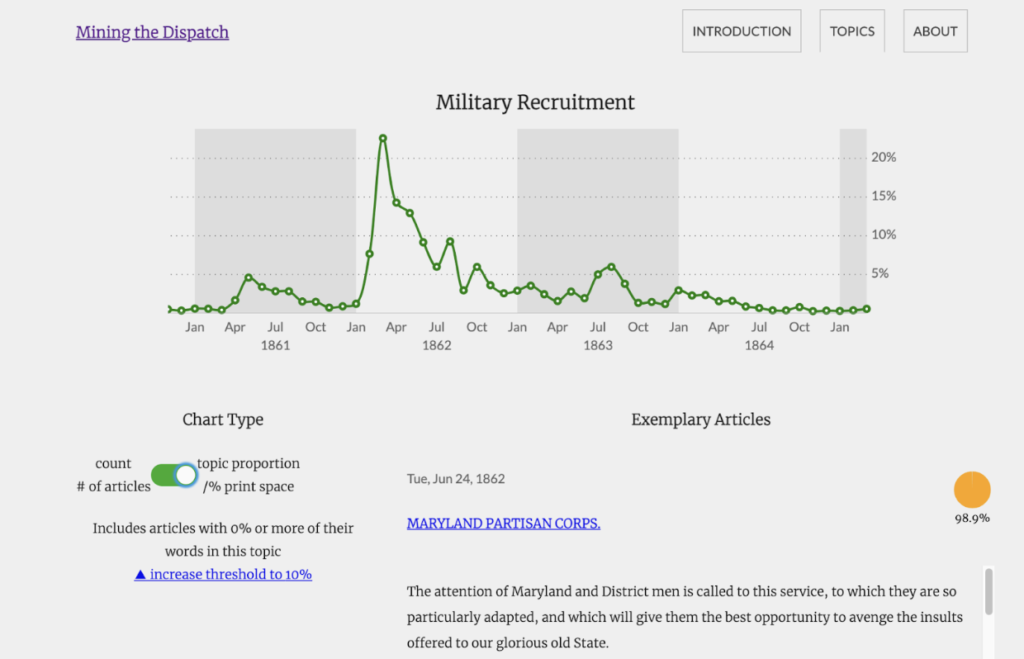
At its core, this project is a data visualization project, but it also incorporates a lot of text and information to accompany and contextualize the data. The authors also allowed for a certain level of interactivity with the graphs, a clear advantage of the digital format over a physical one for this humanities project. On each graph, you can choose to see either the count of articles about a given topic for each month or the percentage of print space devoted to the topic.
The first layer of this DH project, the data, is very straightforward. According to the webpage’s “about” section, the sources for this project are (unsurprisingly) original articles from The Daily Dispatch between the years of 1860 and 1865.
Next, it appears that the authors took the raw data from the newspaper and processed it. The “about” section credits the use of the MALLET Software Package, which the authors describe as “an amazing tool for analyzing large text corpora.” That plus writing the explanation and context represents the second layer of this DH project.
Finally, the authors chose to present this project as an interactive website with a few pages and varying degrees of information on each page. They used a sleek and concise design so as not to distract from the content. Each graph can be clicked on to open up more information and customization on its presentation of the data that the authors processed.
A new question this project puts forth for me is “what might this look like in other newspapers?” or “what happens when we expand the corpus?” I think comparing just Richmond’s paper to a much larger set of newspapers at the time might reveal some information about the city.
Answers to two discussion questions from class:
- Who made the website? What are their relationships to the institution?
Again from the “about” section, it’s clear that this website was created by Robert K. Nelson who is the Director of the Digital Scholarship Lab at the University of Richmond. He was also helped by “Digital Scholarship Staff” who are listed by name later in the “about” page.
- Which academic fields (i.e history) do you see the project in conversation with?
I’d say this project spans all sorts of academic fields. Historians would be interested in what it has to say about the city and people at the time. Literary critics would be interested in its exploration of journalism as a discipline. Linguists would be interested in print space and word frequency. Digital Humanists and computer scientists would be interested in the creation and process of the project like we are (meta). This project opens the door for conversation and collaboration both within and across each of these fields.

This is really cool! Looking at different news trends over time sounds super interesting. I like how you can see the peak in military recruitment during the civil war in the graph you included. Looking at the website, it’s fun trying to explain the different peaks in the topics given what was happening in the US at the time.
Wow, this is a very interesting project! It is great that the websites allow for user interaction in order to keep them engaged in the project. I was wondering what types of topics the website analyzes over time? What kind of information accompanies the graphs? Are there links to the actual articles from the Daily Dispatch so that users can follow up on information?